Hello Everyone,
For the month of December, the team is proud to say that our prototype works! We gave a presentation to the department last Friday and we are very happy with the feedback and the results that we got.
 this is the data that you see in the video. The high amplitudes mean the person arm muscles were relaxed, low amplitude means the arm was flexed.
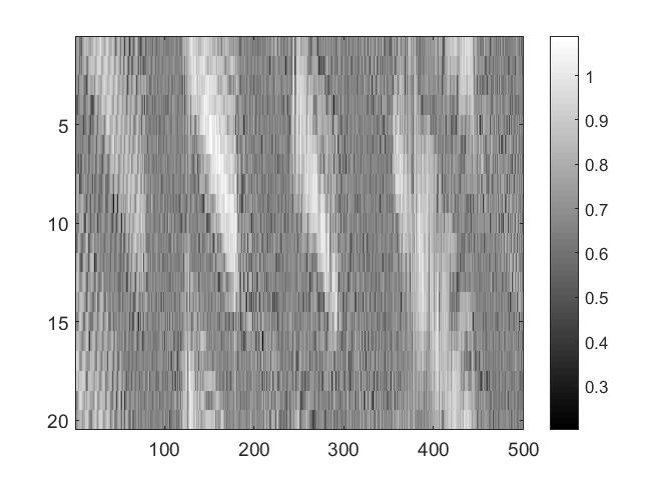
From the data above, we were able to create m-mode images. M mode also known as motion mode is A diagnostic ultrasound presentation of the temporal changes where the depth of echo-producing waves is displayed along the x-axis which is time and the y-axis, the motion of the interfaces from the transducer.
This is an m-mode image of when the person was flexing and relaxing their arm.

Hope you enjoyed this post.
From the ZECK team we want to wish the students good luck in the finals and